Profiling Your Specification
Warning: Profiling only works in the incremental SMT mode, that is,
when the model checker is run with --algo=incremental,
or without the option --algo specified.
As Apalache translates the TLA+ specification to SMT, it often defeats our intuition about the standard bottlenecks that one learns about when running TLC. For instance, whereas TLC needs a lot of time to compute the initial states for the following specification, Apalache can check the executions of length up to ten steps in seconds:
---------------------------- MODULE powerset ----------------------------
EXTENDS Integers
VARIABLE S

Init ==
    /\ S \in SUBSET (1..50)
    /\ 3 \notin S

Next ==
    \/ \E x \in S:
        S' = S \ {x}
    \/ UNCHANGED S

Inv ==
    3 \notin S
=========================================================================
Apalache has its own bottlenecks. As it's using the SMT solver z3,
we cannot precisely profile your TLA+ specification. However, we can profile
the number of SMT variables and constraints that Apalache produces for different
parts of your specification. To activate this profiling mode, use the option
--smtprof:
apalache check --smtprof powerset.tla
The profiling data is written in the file profile.csv in the run
directory:
# weight,nCells,nConsts,nSmtExprs,location
4424,2180,2076,28460,powerset.tla:11:5-13:18
4098,2020,1969,12000,powerset.tla:12:9-12:20
4098,2020,1969,12000,powerset.tla:12:14-12:20
...
The meaning of the columns is as follows:
-
weightis the weight of the expression. Currently it is computed asnCells + nConsts + sqrt(nSmtExprs). We may change this formula in the future. -
nCellsis the number of arena cells that are created during the translation. Intuitively, the cells are used to keep the potential shapes of the data structures that are captured by the expression. -
nConstsis the number of SMT constants that are produced by the translator. -
nSmtExprsis the number of SMT expressions that are produced by the translator. We also include all subexpressions, when counting this metric. -
locationis the location in the source code where the expression was found, indicated by the file name correlated with a range ofline:columnpairs.
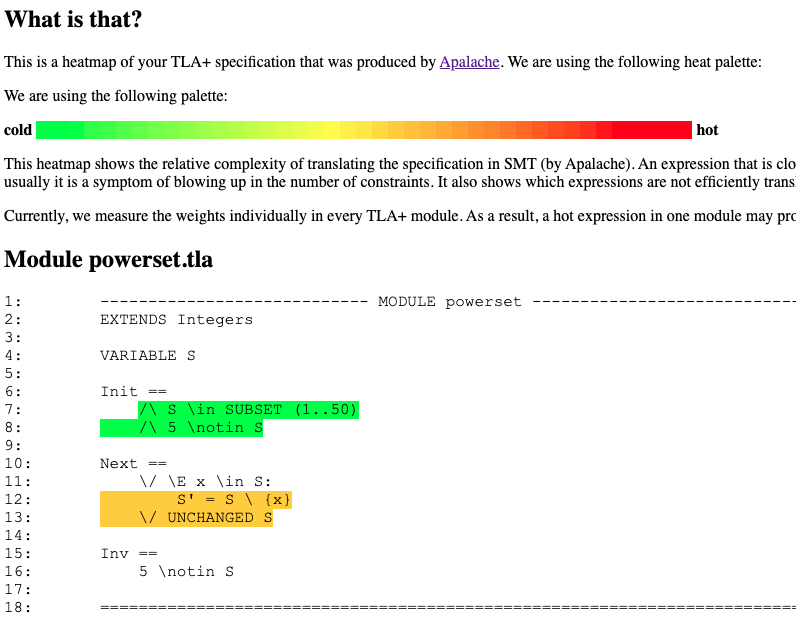
To visualize the profiling data, you can use the script script/heatmap.py:
$APALACHE_HOME/script/heatmap.py profile.csv heatmap.html
The produced file heatmap.html looks as follows:

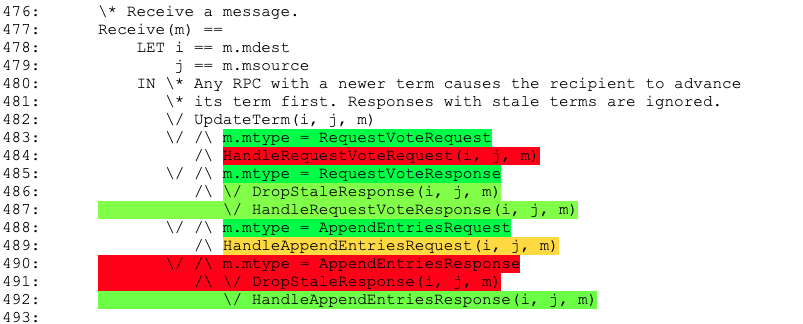
The heatmap may give you an idea about the expression that are hard for Apalache. The following picture highlights one part of the Raft specification that produces a lot of constraints:
